Periodic Analysis of Exports of Drugs, Pharmaceuticals & Fine Chemicals (Period April 2010 to February 2011)
Periodic Analysis of Exports of Drugs, Pharmaceuticals & Fine Chemicals (Period April 2010 toFebruary2011)
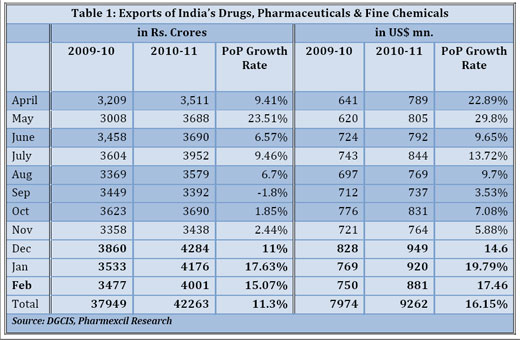
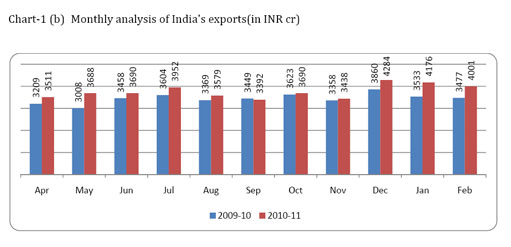
India’s exports of Drugs, pharmaceutical & fine chemicals stood at Rs.42263 Crore for the eleven month period from Apr2010 – Feb 2011 with a growth rate of 11.33 % compared to the same period during the previous year. In US$ terms the exports have recorded 16.15% growth increasing to US$9.26bn as against US$7.97bn. For the corresponding period of the previous year (refer table 1 & Charts 1&2). Third consecutive month in the year 2010-2011 sales have crossed INR 4000 crore during February 201,1 though in February, there is a dip to a tune of 175 crore in comparison to Jan 2011 sales.
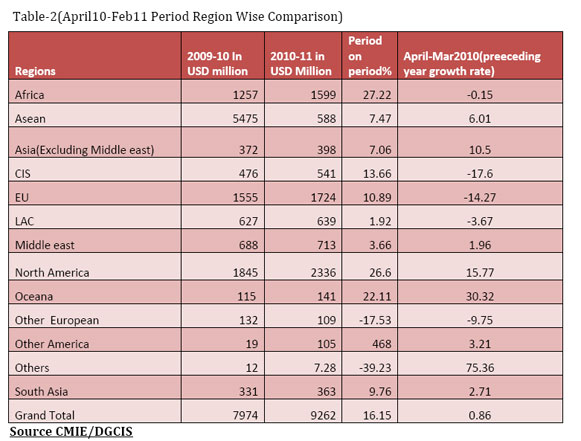
Region-wise exports are given in table 2. Cumulative February growth rate is around 16.15% slightly better than cumulative Apr10-Jan11. Exports to North America continue to grow at a higher rate Africa and Oceana are also growing higher than the average growth. Exports to CIS, EU, South Asia, Asia(Excluding middle east), LAC & Asean though growing less than average have grown better in comparison to Cum Jan 11.
USA continues to be the best destination country of our exports though the contribution to Total exports from USA is slightly down during the period, which has come down to 23.69 from 24.16% of the exports during Apr10-Jan 2011, with a Period-on-Period (POP) growth of 29%. UK is the second best destination with a POP of 9% and a share of 3.59% of total exports.
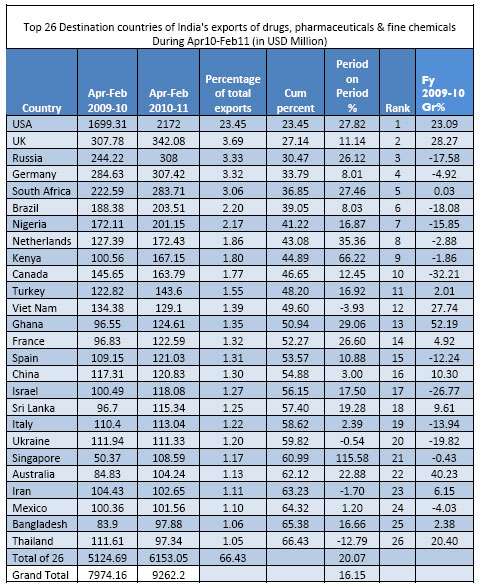
During Apr10-Feb11 our exports to Vietnam though have recorded a negative growth has improved growth rate in comparison to April10-Jan 11 period. Exports to Ukraine & Iran Cumulative Feb 2011 have slipped into negative. Exports to UAE though continued in the same pattern as last month but slipped in ranking to 27th.
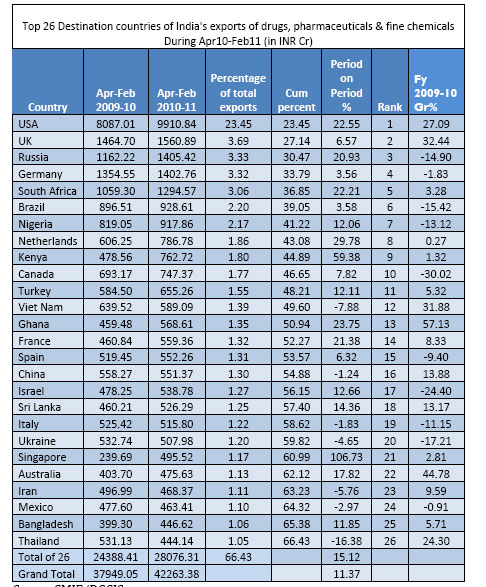
As a group the top 26 destinations, India’s exports has recorded a growth rate of over 20.07% & 15.02% in USD and INR respectively, during the period of the two financial years in study, the exports to rest of the world, while IN INR terms is 4.6%, has grown by 9% in USD terms.
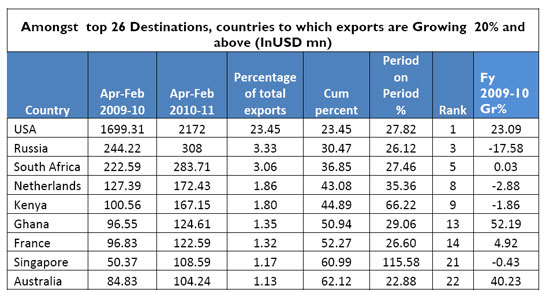
Amongst table-4 showing countries growing above 20%, Singapore, Month after Month continues to top the growth rates has recorded around 116% cumulatively. It is heartening to note that exports to USA continue to grow above 25% which is high above the average growth during the period. Exports to Kenya have also grown exceptionally (66%). Ghana continues to feature in this group. Exports to Netherlands& France have fared like in April10-Jan11, & to south Africa the rate of exports are better than last month analysis. Nine countries are featuring in this group as against ten during last analysis. Turkey & Bahamas does not feature in this group this time, while exports to Russia have gained a good momentum.
Our exports to UK & Sri Lanka are growing faster during Apr-Feb 2011, Exports to Turkey slowed down a bit. Exports to Spain and Canada have grown almost at the same pace as during last analysis. .
Exports to Bangladesh have picked up well growing at almost 17% cumulative.